Amazon FBA Product Research: The Checks Before You Order
TL;DR: Amazon FBA product research means proving four things before you pay a factory: real search demand, a margin that survives Amazon's fees, an ad cost per sale you can afford at launch, and enough cash to fund a long inventory cycle. Most research stops at demand. In the accounts we manage, a sale from ads costs about $12.89 at median click prices, and one ocean order can tie up cash for 200 days.
Table of Contents
- What should Amazon FBA product research actually prove?
- Check 1: Is the demand real and reachable?
- Check 2: Does the margin survive Amazon's fees?
- Check 3: What does a sale cost you at launch?
- Check 4: Can you fund the cash cycle?
- A go or no-go sheet for every candidate
- Where FBA product research usually goes wrong
- Where to start
- Frequently Asked Questions
Most product ideas fail after the research looked fine. The demand was real and the reviews were beatable. What sank them was a number nobody checked: the referral fee in that category, the click cost to get the first 100 sales, or the months of cash sitting in a container.
This page treats research as a set of pass or fail checks. Each one uses either Amazon's published numbers or data from the brands SellerPlex runs. If you want the broader idea generation side first, our guide to Amazon product research strategies covers where to find candidates.
What should Amazon FBA product research actually prove?
It should prove that one specific product can make money after every cost Amazon and the market will charge you. Finding something that sells is the easy half. The hard half is showing that you can sell it profitably at the volume your first order assumes.
A useful way to run it is four checks in a fixed order, cheapest first:
- Demand: are shoppers searching for this, and do they convert on the current offers?
- Unit margin: what is left after the referral fee, the FBA fulfillment fee and storage?
- Launch cost: what does each ad-driven sale cost while you have no reviews and no rank?
- Cash cycle: how many days does your money sit between paying the factory and getting paid by Amazon?
A product that fails check two never needs check four. That order saves you weeks.
Check 1: Is the demand real and reachable?
Demand is real when people search for the problem your product solves and buy from more than the top two or three listings. A single dominant brand with most of the reviews usually means the niche is closed to a new seller.
Amazon's own Product Opportunity Explorer is the best first stop because it uses Amazon's search and purchase data. You open it in Seller Central under Growth. It groups search terms into niches based on what customers view or buy after searching. It also flags "unmet demand", meaning search terms that convert below the benchmark, which suggests shoppers are not finding what they want.
Amazon says products launched using insights from the tool have 2.5x higher sales potential in their first three months, based on its 2025 internal data. Treat that as Amazon's claim about its own tool. The useful part for you is the conversion signal: high searches plus weak conversion points to a gap you can fill with a better product or a better listing.
Read the Best Sellers Rank over time
A rank snapshot lies. One screenshot can catch a lightning deal or a seasonal spike. Track the rank of the top listings for at least a few weeks, and check whether sales spread across the first page or sit with one brand. Our explainer on reading the Amazon Best Sellers list shows how to separate a durable seller from a short trend.
Research tools help here too. They model sales from rank movements, so cross-check any promising product against a second source before you trust the estimate. Our comparison of product research tools covers what each type of tool is good at.
Check 2: Does the margin survive Amazon's fees?
The margin survives when your selling price, minus landed cost, referral fee, fulfillment fee and storage, still leaves room for advertising and profit. Run the numbers per unit before you contact a supplier.
Start with the referral fee, because it is fixed by category. According to Amazon's selling plan and referral fee page, Home and Kitchen, Sports and Outdoors, Toys and Games and Pet Supplies all charge 15% with a $0.30 minimum. Computers and Consumer Electronics charge 8%. Beauty, Health and Personal Care charges 8% on items priced at $10.00 or less and 15% above that. On a $30 kitchen product, the referral fee alone is $4.50.
The fees that change with size and time
FBA adds a fulfillment fee per unit, set by size and weight, and monthly storage based on the cubic feet your stock occupies. Amazon's FBA overview also lists an aged inventory charge for items stored more than 181 days. A product that is cheap to make but bulky can lose its whole margin to these two lines.
Price every candidate with the Revenue Calculator in Seller Central, using the sample's measured dimensions and weight. A box that is half an inch over a size tier pays the higher fee on every unit it ever ships. That is a packaging decision you can still change during research.
Check 3: What does a sale cost you at launch?
At launch, most of your sales come from ads, so the real question is how much ad spend one order costs. You can estimate it before you buy inventory with two numbers: cost per click and the share of clicks that turn into orders.
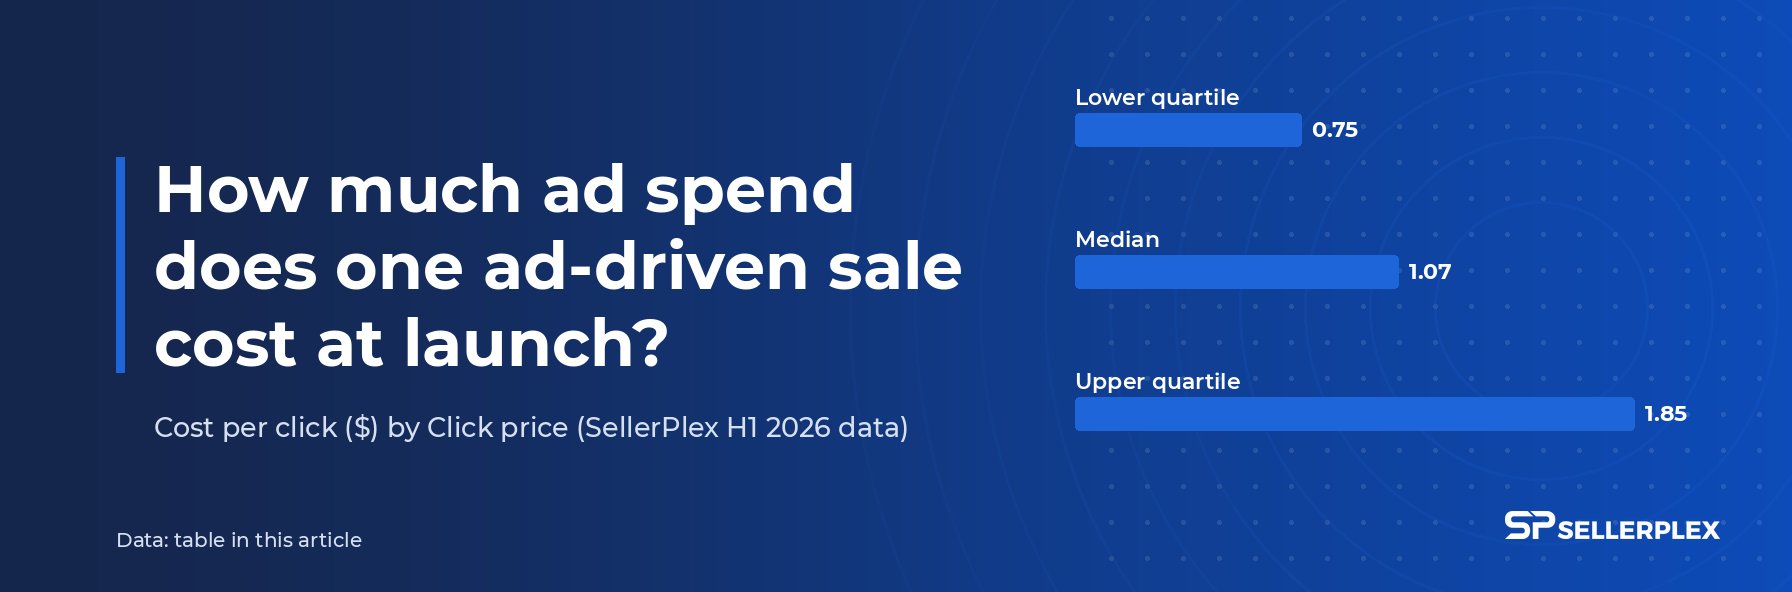
We measured both across more than 30 US accounts we manage for our Amazon PPC benchmarks. In the first half of 2026 the median blended cost per click was $1.07, and the median ad conversion rate was 8.3%. The middle half of accounts paid between $0.75 and $1.85 per click.
How much ad spend does one ad-driven sale cost at launch?
| Click price (SellerPlex H1 2026 data) | Cost per click ($) | Ad spend per order at 8.3% conversion ($) |
|---|---|---|
| Lower quartile | 0.75 | 9.04 |
| Median | 1.07 | 12.89 |
| Upper quartile | 1.85 | 22.29 |
Put that next to your unit margin. If a $30 product keeps $9 after fees and landed cost, a median launch sale loses money on every ad order. That can be fine for a few weeks while you build reviews and rank. It stops being fine if the category is in the upper quartile and stays there.
Click costs also moved within the half. Our median CPC rose from $0.99 in January 2026 to $1.36 in June 2026, a 37% climb. Build your launch budget on the click price you will pay in your launch month, not the cheapest month on record.
Test Your Product Idea Against Real Account Data
Walk through demand, fees, launch ad cost and cash cycle with a SellerPlex strategist before you place the order.
Talk to a StrategistCheck 4: Can you fund the cash cycle?
You can fund it if you have cash for the full time between paying for production and collecting Amazon payouts, plus the next order that has to be placed before the first one sells through. For an ocean-freighted product, that cycle is long.
This is the pipeline we plan for one of the brands on our supply chain management service, where every leg is scheduled so stock lands before the previous batch runs out.
How many days does an FBA order tie up cash?
| Pipeline leg | Days |
|---|---|
| Production | 45 |
| Ocean transit | 65 |
| Inland freight | 15 |
| 3PL buffer | 30 |
| Amazon stock | 45 |
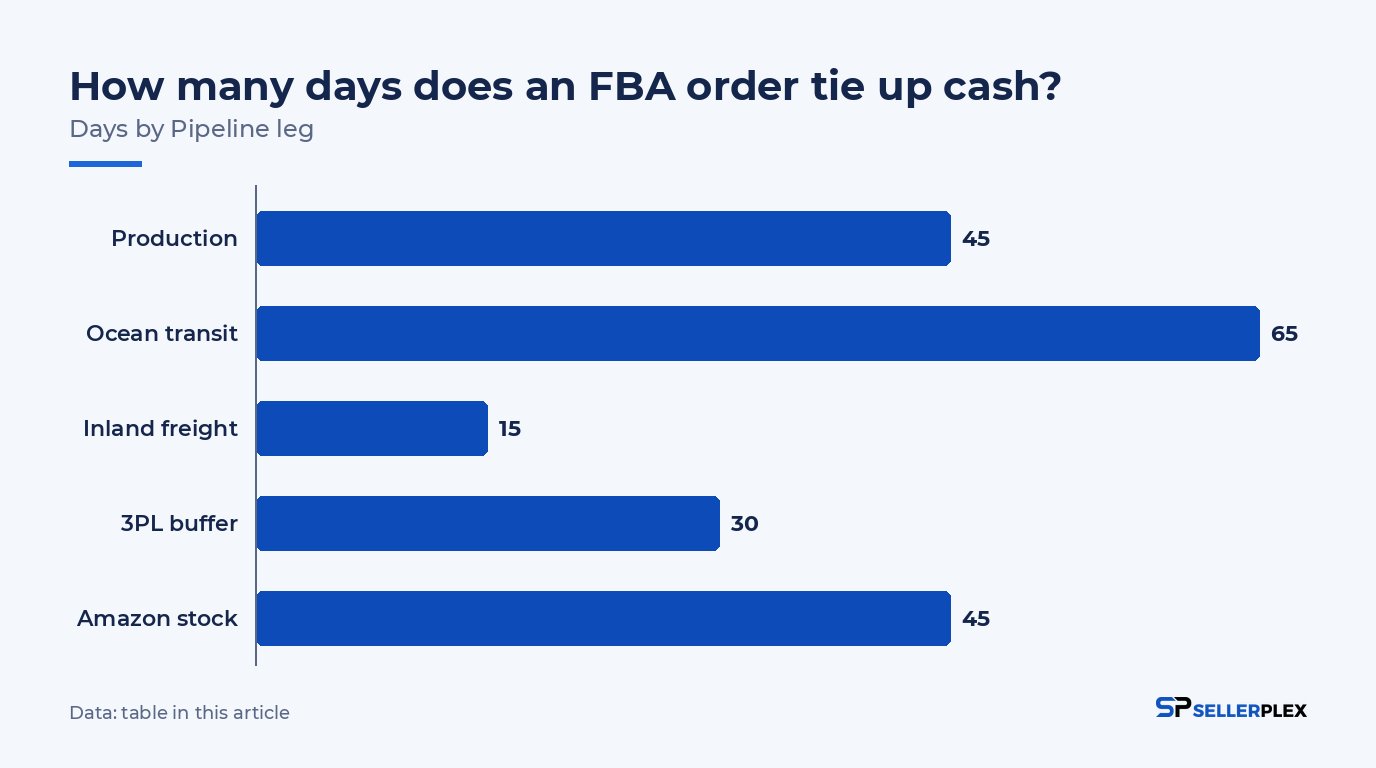
That adds up to 200 days of cover. Amazon's FBA guide for beginners recommends keeping about two months of inventory available in FBA and sending a small batch first for a new product. Those two months are only the last leg. Your reorder has to leave the factory long before the stock on Amazon gets low.
Planning this way changes results. Gold Coastal cut its rush air shipments by 80% after moving to a 200 day pipeline plan. Vidal Crafts ran at 95% in stock for the year after our supply chain audit.
What this means for product choice
A product with fast factory turnaround and a domestic supplier has a much shorter cycle. The cash it needs is lower, and a wrong forecast costs less. When two candidates look equal on demand and margin, the one with the shorter cycle is usually the safer first product.
A go or no-go sheet for every candidate
A candidate goes ahead only when it passes all four checks with numbers you wrote down. Keep one row per product so you compare ideas on the same terms.
| Check | Pass looks like | Where the number comes from |
|---|---|---|
| Demand | Steady rank across weeks, sales spread over page one | Product Opportunity Explorer, rank history |
| Unit margin | Room for ads and profit after all fees | Referral fee table, Revenue Calculator |
| Launch cost | Ad cost per order fits inside the margin within a few months | Category CPC, ad conversion rate |
| Cash cycle | Cash for the full cycle plus the next order | Supplier lead time, freight quotes |
Write the failure reason next to every rejected idea. After 20 or 30 candidates, the pattern in those reasons tells you which categories fit your cash and your team.
Where FBA product research usually goes wrong
It usually goes wrong at the handoff from research to operations. The spreadsheet assumed a landed cost, a click price and a lead time, and nobody checked them again once the order was placed.
The common misses we see when we take over an account:
- The sample was measured in the wrong packaging, so the size tier changed at production.
- The launch budget used last quarter's click prices.
- The reorder was placed when stock on Amazon looked low, which in a 200 day cycle is already late.
- Nobody priced the aged inventory charge on a slow variation.
Each of these is cheap to catch before the first purchase order and expensive after it.
Where to start
Take your current best idea and run it through the four checks this week, in order. Write the actual numbers in the sheet above. If it fails, you saved an order. If it passes, you have the inputs your launch, ads and reorders will need.
If you want a second opinion from people who run these numbers daily, book a strategy call with SellerPlex and bring the sheet.
Frequently Asked Questions
How long should Amazon FBA product research take for one product?
For one product, plan on one to two weeks. Demand needs a few weeks of rank history, so start tracking early. Fee and margin checks take an afternoon once you have a sample with real dimensions. Supplier lead times and freight quotes usually take the longest, because they depend on replies from factories and forwarders.
Is Product Opportunity Explorer enough on its own?
It is the strongest demand source because it uses Amazon's own search and purchase data. It does not price your product, quote your freight or estimate your launch ad cost. Use it for the demand check, then use the Revenue Calculator, your supplier quotes and category click prices for the other three checks.
What referral fee will I pay on Amazon?
It depends on the category. Amazon's published table lists 15% with a $0.30 minimum for Home and Kitchen, Sports and Outdoors, Toys and Games and Pet Supplies. Computers and Consumer Electronics are 8%. Some categories use tiers, such as Beauty at 8% up to $10.00 and 15% above.
How much should I budget for ads when launching a new FBA product?
Budget from ad cost per order. Across the accounts we manage, the median click cost $1.07 in the first half of 2026 with an 8.3% ad conversion rate, so one ad order cost about $12.89. Multiply by the orders you need for early reviews and rank, then add a buffer.
Why does the cash cycle matter so much for a first product?
Your cash is locked from the factory deposit until Amazon pays out on sold units. With ocean freight that cycle can reach 200 days, and the next order has to be paid before the first one sells through. A product with a short cycle lets you learn faster with less money at risk.
Next step: Talk to a Strategist. Book a free strategy session with our Amazon and e-commerce specialists. No obligations, just actionable insights.