
Most Amazon brands scale on the wrong number. Revenue feels like progress, gross sales look healthy in Seller Central, and the monthly deposit lands. Then the bank balance does not move the way the top line suggests it should. The gap between those two facts is what amazon seller profit analytics is meant to close.
Table of Contents
- Why revenue is a misleading scorecard on Amazon
- The true-cost waterfall: every line that hits a SKU
- Contribution margin is the number that drives decisions
- The parent and variation problem most reports miss
- Why your dashboards disagree
- A profit-truth audit you can run this week
- From measurement to decisions
- When profit analytics needs an operating team
- Frequently Asked Questions
- Where to start
Profit analytics is not a dashboard you buy. It is the discipline of measuring true profit at the SKU level after every cost Amazon, advertising, logistics, and customer behavior take out of a sale. Done well, it tells you which products deserve more capital, which variations quietly lose money, and which “best sellers” are actually funding their own losses through ad spend and returns. Done poorly, or not at all, it lets a brand scale unprofitable revenue until cash runs out.
This article breaks down what to measure, why the numbers usually disagree across systems, and how to turn a clean profit picture into the reprice, bundle, cut, and scale decisions that move real money.
Why revenue is a misleading scorecard on Amazon
Revenue tells you demand exists. It says almost nothing about whether that demand is worth serving. Two products with identical revenue can sit on opposite sides of profitability once you account for fees, fulfillment, and advertising.
The reason is that Amazon costs are layered and uneven. A lightweight, high-price item with low return rates behaves very differently from a heavy, low-margin item that attracts frequent returns and high storage exposure. Company-level net profit hides this completely. You can grow total revenue, watch blended margin look stable, and still be expanding the exact SKUs that are bleeding cash.
Profit analytics replaces the comfortable company-level view with an uncomfortable but useful SKU-level view. That shift is where most of the value is.
The true-cost waterfall: every line that hits a SKU
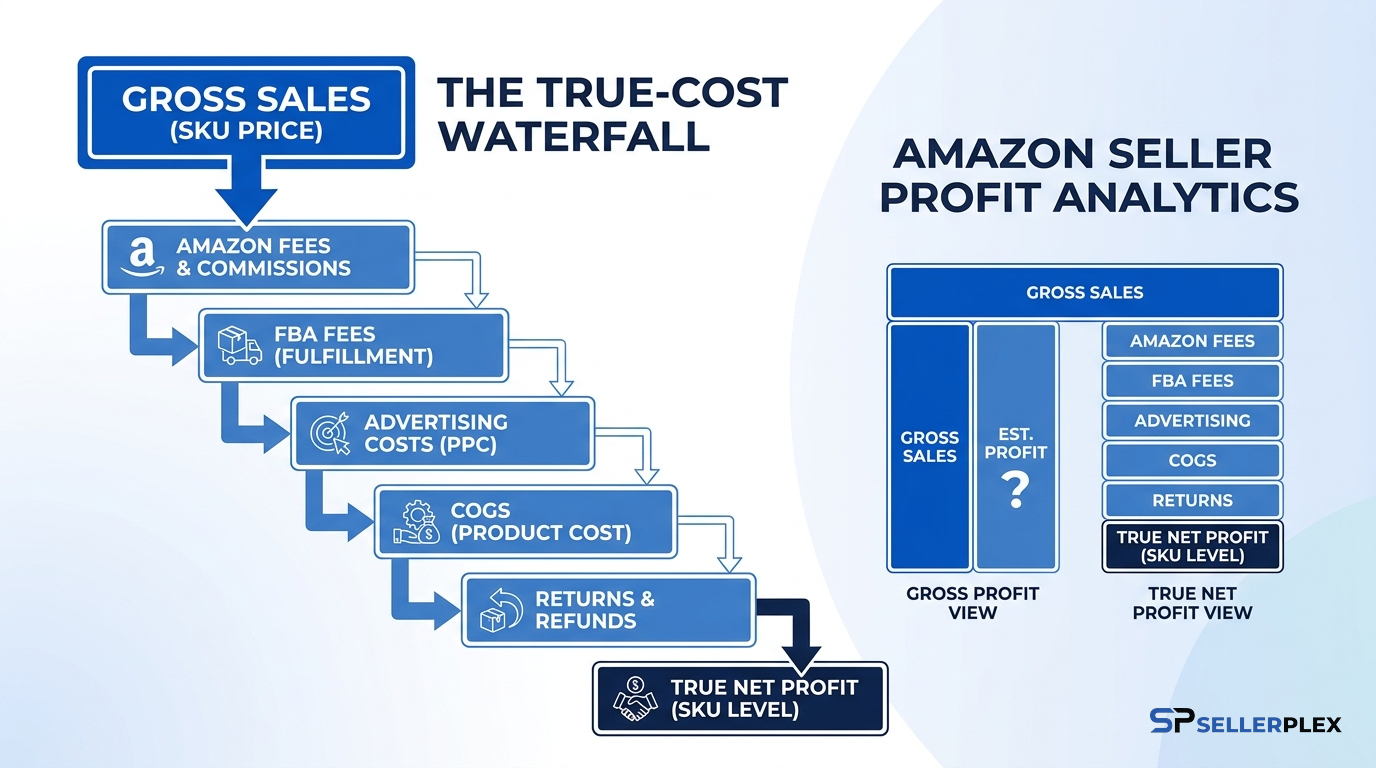
Before you can trust a profit number, you need to capture every cost that touches a unit. Amazon’s selling plans and pricing page explains the platform fee categories, and the FBA Revenue Calculator is a useful baseline for fee and fulfillment assumptions, but your internal model has to go further than either tool.
A complete per-SKU waterfall usually includes:
- Referral fees by category
- FBA fulfillment fees by size and weight tier
- Monthly and long-term storage fees
- Advertising spend attributed to the SKU
- Coupons, deals, and promotional rebates
- Returns and refund processing
- Removal and disposal fees
- Inbound freight and prep
- Chargebacks and reimbursements
- Landed product cost and duties
Skip any of these and the number lies. The most common omissions are storage, returns, and accurately attributed ad spend, and those three are exactly where thin-margin SKUs go negative without anyone noticing.
Contribution margin is the number that drives decisions
The single most useful output of profit analytics is contribution margin per unit and per SKU. Contribution margin is what remains after all variable costs, and it is the figure that tells you whether selling one more unit helps or hurts. Investopedia’s primer on contribution margin is a clean refresher on the concept.
For an Amazon SKU, contribution margin answers the question that revenue cannot: if I push more volume through ads and promotions, do I make money or buy losses? A SKU with strong contribution margin can absorb launch spend and defend rank. A SKU with thin or negative contribution margin gets worse the more you scale it, because every incremental sale carries the loss.
Tracked over time, contribution margin also exposes drift. Fee changes, rising storage exposure, and creeping return rates erode margin slowly, and a quarterly look at per-SKU contribution catches that erosion before it becomes a cash problem.
The parent and variation problem most reports miss
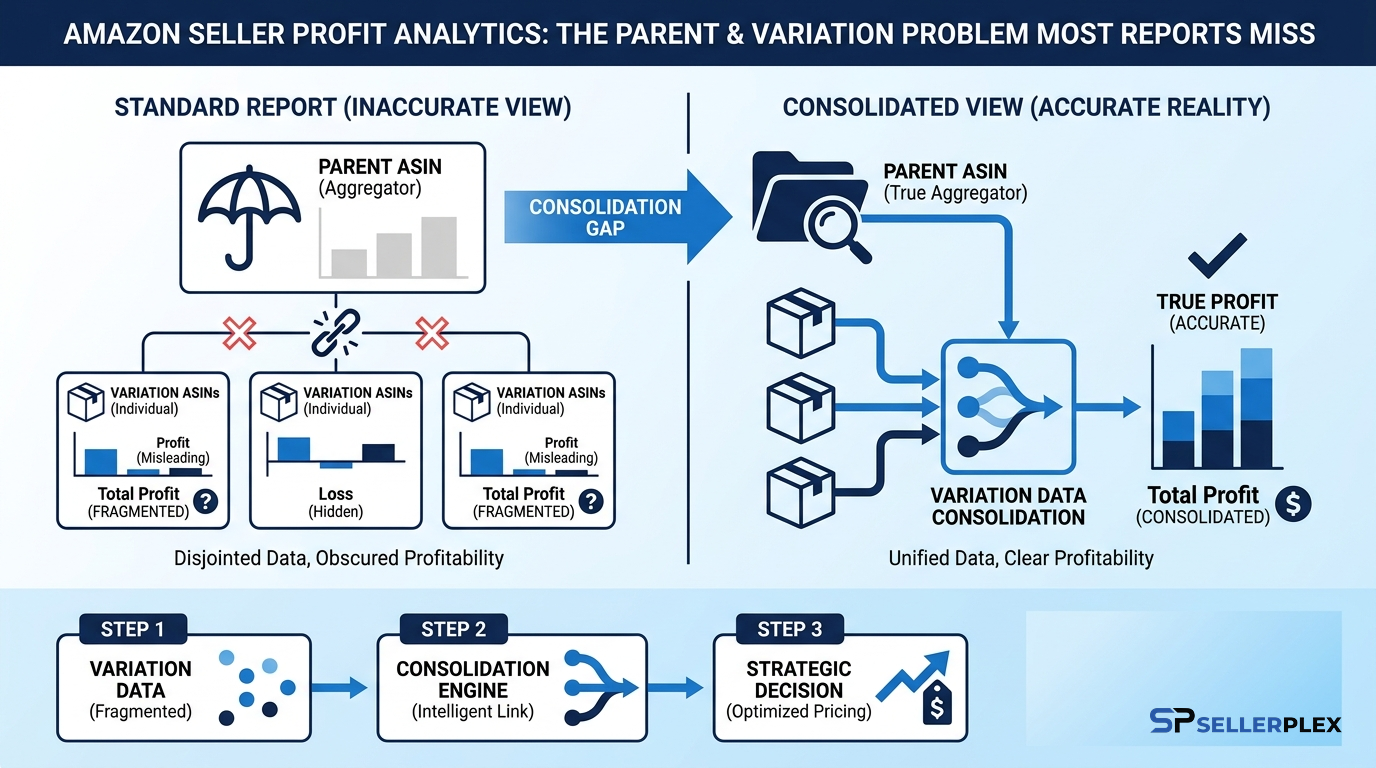
Variation-level blindness is one of the biggest gaps in seller profit reporting. A parent listing can look profitable while specific child variations lose money on every order. Sizes, colors, and bundle configurations rarely share the same cost structure, return rate, or ad efficiency.
Good profit analytics breaks results down to the child ASIN. That is where you find the variation that carries the parent and the one that quietly drags it down. Once you can see it, the decisions get obvious: trim the loss-making variation, reprice it, or rebuild its offer. Without variation-level data, you are averaging winners and losers together and calling the blur a strategy.
This connects directly to product selection. The same margin discipline you apply to existing variations should govern what you launch next, which is why evaluating demand with best product research tools only works when it is paired with a real landed-cost and contribution model.
Why your dashboards disagree
Here is the moment most founders recognize. The advertising console reports one ACOS. The accounting file shows a different profit. Inventory data lives in a third system. By Sunday night the founder is reconciling all three in a spreadsheet, unsure which number to trust.
The dashboards disagree because they measure different things over different time windows. Ad platforms attribute spend on the day of the click, not the day of the sale. Accounting recognizes revenue on settlement. Inventory systems value units at cost. None of them is wrong on its own, but none of them is a profit statement either.
Profit analytics is the reconciliation layer that ties spend, fees, settlements, and unit costs back to a single SKU-level truth. If your ad spend on a SKU is not being subtracted from that same SKU’s revenue in the same period, your profit number is fiction. Clean attribution is also what lets you judge whether Amazon PPC management is acquiring profitable customers or simply renting rank.
A profit-truth audit you can run this week
You do not need new software to start. You need a structured view of where your profit numbers come from and who owns each one. Build a simple table:
Blank cells are blind spots. Low-confidence cells are risk. Duplicate sources are also risk, because they create the dashboard disagreements above. Storage cost exposure in particular ties back to inventory planning, and the practical steps in Amazon inventory management tips help reduce the stranded-stock and long-term storage fees that silently eat margin.
From measurement to decisions
Measurement only matters if it changes what you do. A trustworthy profit picture should drive five recurring decisions:
- Scale: put more ad budget and inventory behind SKUs with strong contribution margin and room to grow
- Reprice: lift prices where contribution is thin but demand is inelastic
- Bundle: combine slow movers with winners to raise average contribution and reduce return friction
- Fix: rebuild listings, offers, or cost structures on SKUs that are close to viable
- Cut: discontinue or deprioritize SKUs that lose money at every realistic price
The goal is a weekly and monthly rhythm, not a one-time spreadsheet. Weekly, you watch ad-driven contribution and stockout risk. Monthly, you review SKU-level margin drift and act on the five decisions above. That cadence is what separates brands that scale profit from brands that simply scale revenue.
When profit analytics needs an operating team
A spreadsheet can hold the model. It cannot run the operation. As SKU count, marketplaces, and ad budgets grow, the work of pulling clean data, attributing spend, reconciling systems, and acting on the decisions outgrows founder oversight. The number becomes stale exactly when the stakes get higher.
This is the point where many brands move from software to an operating partner. A capable team owns the profit model, keeps attribution honest, and turns the analysis into pricing, inventory, and advertising action every week. The 2026 guide to choosing an Amazon FBA agency covers what that partnership should actually deliver and how to evaluate one.
Turn Profit Data Into Decisions
Get a senior review of where your SKU-level profit is leaking and what to scale, reprice, or cut next.
Frequently Asked Questions
What is amazon seller profit analytics?
Amazon seller profit analytics is the practice of measuring true profit at the SKU level after every cost Amazon, advertising, logistics, and customer behavior take out of a sale. It goes beyond revenue and company-level net profit to show contribution margin per product and per variation, so you can decide what to scale, reprice, bundle, or cut.
Why is my Amazon revenue high but profit low?
High revenue with low profit usually means specific SKUs or variations are losing money after fees, ad spend, storage, and returns. Company-level reporting averages winners and losers together, so the losses stay hidden until you break results down to the SKU and child-variation level.
Which costs do sellers most often forget to include?
The three most commonly missed costs are storage fees, returns and refunds, and accurately attributed advertising spend. These are also where thin-margin products tend to go negative, which is why leaving them out makes a profit number unreliable.
How often should I review SKU-level profit?
Use a two-tier rhythm. Review ad-driven contribution margin and stockout risk weekly, and review full SKU-level margin drift monthly. Quarterly, check for slow erosion from fee changes, rising storage exposure, and creeping return rates.
Do I need special software for profit analytics?
Not to start. You can run a structured profit-truth audit in a spreadsheet by mapping every cost to each SKU and assigning an owner to each number. Software helps once the model is sound and the SKU count grows, but clean cost data and clear ownership matter more than any single platform.
Where to start
Do not begin by buying another tool. Begin by building the per-SKU cost waterfall and the profit-truth audit table above, then assign an owner to every number. Once you can see contribution margin by SKU and by variation, the scale, reprice, bundle, fix, and cut decisions become straightforward.
If your brand has outgrown founder-led reconciliation and you want a profit model that drives weekly action, SellerPlex can help turn scattered dashboards into one managed Amazon operating view. Start with a review of your current numbers through our Amazon account management service.
Ready to Grow Your Amazon Business?
Book a free strategy session with our Amazon and e-commerce specialists. No obligations, just actionable insights.
Related reading: What a Good Amazon Listing Optimization Service Actually Does….