


Most sellers think about inventory management for ecommerce only after it hurts them. A hero SKU goes out of stock during its best sales week, or a container of slow movers lands and swallows the cash that was supposed to fund the next purchase order. Both failures come from the same root cause: ordering decisions made on gut feel instead of a system.
Table of Contents
This guide covers the system. Not software recommendations, not warehouse theory, but the specific numbers and routines that keep a seven-figure ecommerce brand in stock without drowning in it.
The two ways inventory kills an ecommerce business
Stockouts are the visible failure. When a product page shows “currently unavailable,” you lose the sale, and on Amazon you lose something worse: rank. The algorithm reads a stockout as a demand signal going dark, and when you come back in stock you often return to page two. Sellers routinely spend thousands in PPC just to buy back the position they gave away for free. Retail research firm IHL Group has estimated that out-of-stocks cost retailers over a trillion dollars a year globally, and ecommerce brands feel a version of that on every dark day per SKU.
Overstock is the quiet failure. Nothing looks broken. Sales continue, the warehouse is full, and yet the bank account keeps shrinking. Cash tied up in slow inventory cannot buy more of what actually sells, and on Amazon that stock accrues monthly storage fees plus an aged inventory surcharge once units cross 181 days. We have audited brands where 30 percent of inventory value sat in SKUs producing 4 percent of revenue. That is not a supply chain, it is a savings account with negative interest.
Good inventory management for ecommerce is the discipline of steering between those two ditches with numbers instead of nerves.
The four numbers that run the system
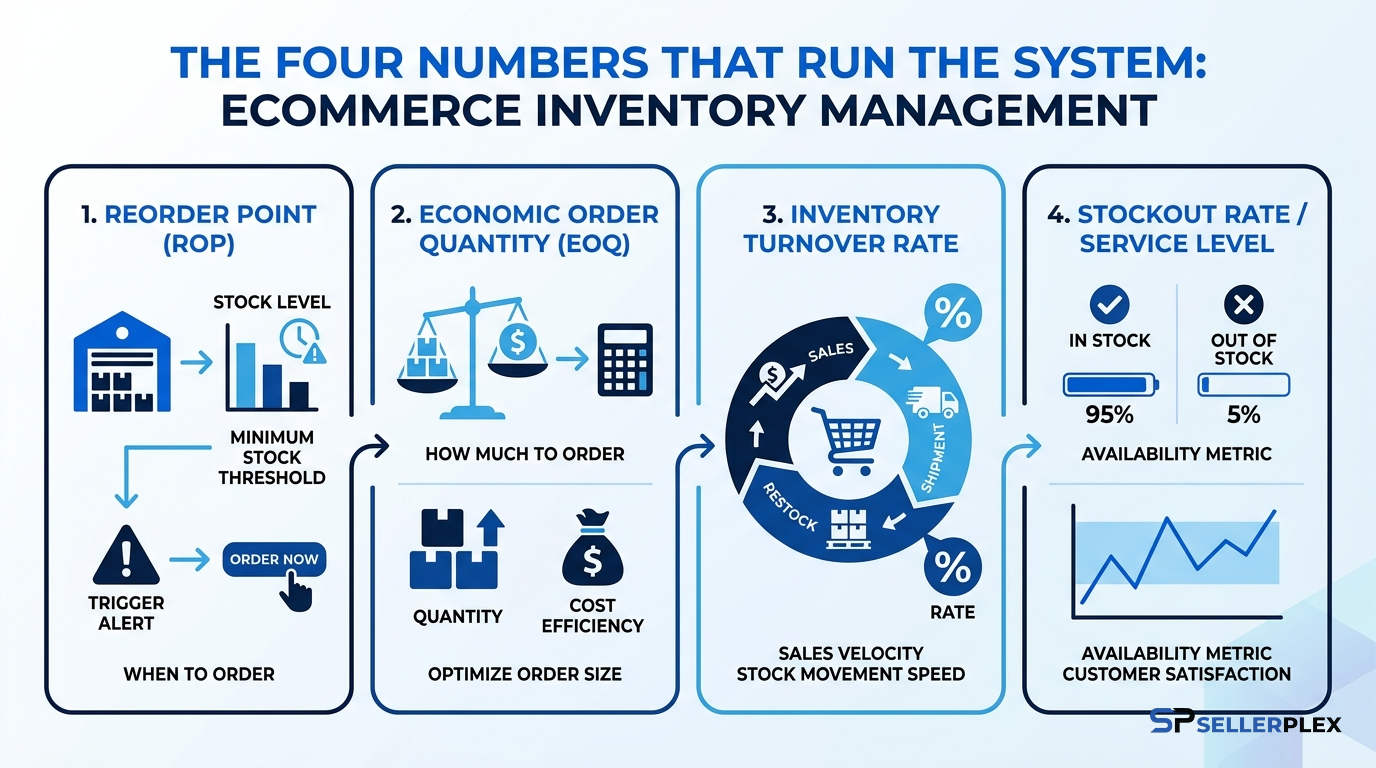
You do not need forty KPIs. You need four, tracked weekly, per SKU.
Sell-through velocity
Units sold per day, averaged over a window that matches your demand pattern. For stable SKUs, trailing 30 days works. For seasonal or promotion-heavy SKUs, use trailing 7 and 90 side by side so a spike does not fool you. Velocity is the input for every other number, so garbage here poisons the whole system. Exclude days you were out of stock when you calculate it, otherwise past stockouts teach the model that demand is lower than it really is, which causes the next stockout.
Days of cover
Current sellable units divided by daily velocity. This is the single most useful health metric because it converts a meaningless raw count (“we have 1,400 units”) into a decision-ready one (“we have 23 days”). Most Amazon-centric brands should hold 45 to 90 days of cover at FBA plus a buffer at a 3PL, adjusted for lead time.
Reorder point
The stock level that should trigger a new purchase order. The formula is simple: daily velocity multiplied by total lead time, plus safety stock. If you sell 40 units a day and your supplier plus freight plus check-in takes 60 days, you need 2,400 units of cover just to survive the replenishment cycle. Order when you hit the reorder point, not when the warehouse “looks low.”
Safety stock
The buffer that absorbs what forecasts miss: a supplier holiday, a port delay, a TikTok video you did not plan. A practical starting point is 20 to 30 percent of lead-time demand for stable SKUs, more for volatile ones. Brands that run supply chains through us usually carry more safety stock on their top three SKUs and less everywhere else, because a stockout on the hero product costs rank while a stockout on SKU number 38 costs almost nothing.
Worked example: a supplement brand sells 55 units a day of its best seller. Lead time is 75 days door to door. Reorder point is 55 x 75 = 4,125 units, plus 25 percent safety stock, roughly 5,150 units. The day sellable inventory crosses below 5,150, a PO goes out. No meeting required.
Forecasting without a data science team
Forecasting sounds intimidating, but for most ecommerce brands a disciplined simple method beats an undisciplined sophisticated one.
Start with trailing velocity, then layer on the things a moving average cannot see. Seasonality first: pull last year’s monthly sales and compute each month’s share of the annual total. If November does 2.1x an average month, your November forecast is trailing velocity times 2.1. Then adjust for known events, in both directions: a planned Lightning Deal adds demand, a price increase usually subtracts some, a competitor going out of stock can double your run rate for two weeks.
The discipline that matters more than the math is the feedback loop. Once a month, compare last month’s forecast to actual sales per SKU. When the miss is bigger than about 20 percent, write down why. After a few cycles you learn your brand’s specific error patterns, which is worth more than any generic model. The Amazon inventory management tactics we covered previously go deeper on the replenishment mechanics side of this loop.
One warning from experience: never forecast off a stockout period, and never forecast off a heavy discount period without tagging it. Both distort velocity in opposite directions, and both errors compound because the bad forecast drives the next PO.
Selling through FBA changes the rules
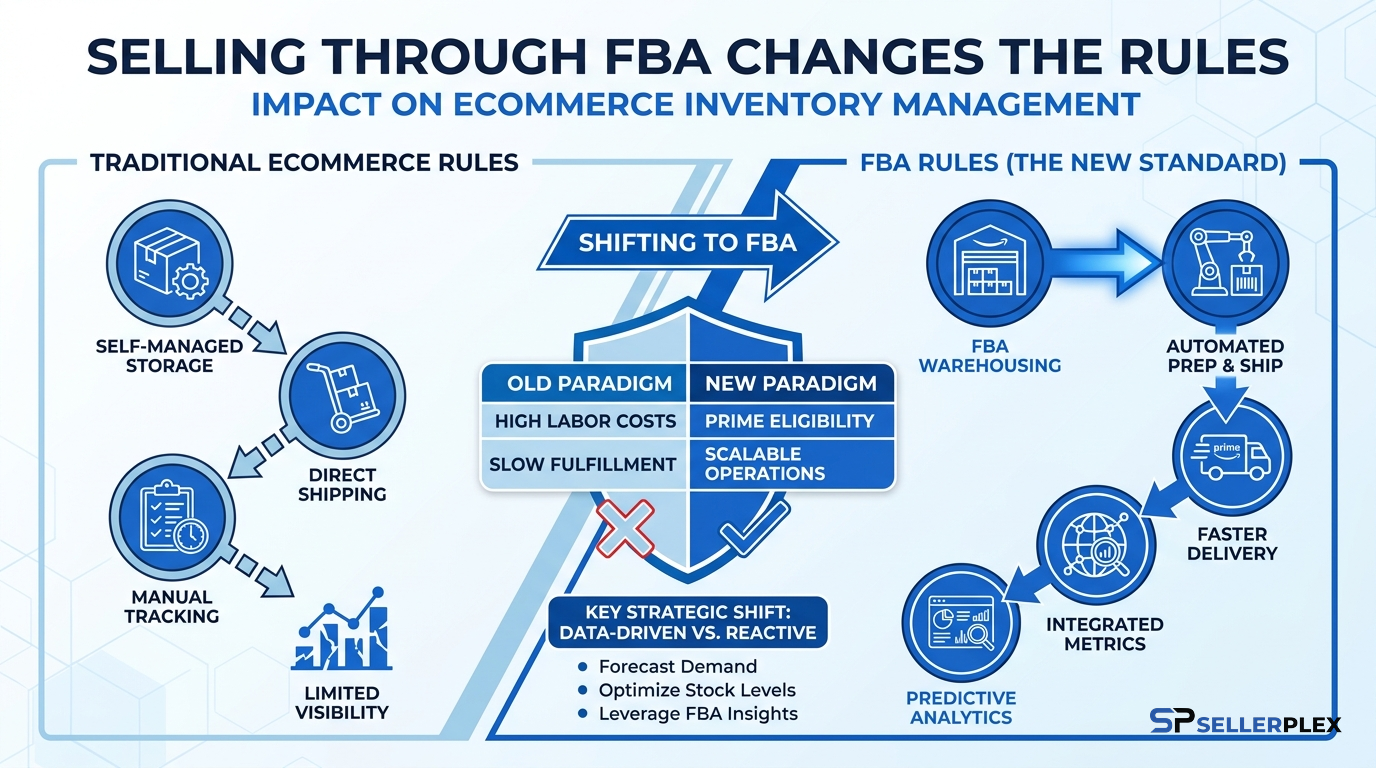
If Amazon is your main channel, inventory management stops being purely your decision, because Fulfillment by Amazon adds constraints of its own.
Capacity limits decide how much you are allowed to send in, and they are driven partly by your recent sell-through. This creates a trap for fast-growing brands: your history understates your future, so your allowance lags your demand. The workaround is structural, keeping bulk stock at a 3PL and drip-feeding FBA with smaller, more frequent shipments so the capacity you do get is always filled with your fastest movers.
Fees punish both directions. Hold too much and monthly storage fees stack up, with the aged inventory surcharge biting hard past 181 days. Hold too little relative to demand and the low-inventory-level fee adds a charge to every outbound unit. Amazon has effectively built financial guardrails around the same two ditches we opened with, and it charges you for driving into either one.
Placement and check-in times also shift with the calendar. A shipment that checks in within days in July can sit for weeks in November. Your lead-time number needs a Q4 version, or your reorder points will be wrong exactly when a stockout is most expensive. We covered the full inbound picture in our guide to building a leaner FBA supply chain.
Stop Guessing What to Reorder and When
Get a free supply chain audit that shows exactly where your inventory is leaking cash and rank.
One pool of stock, many promises
Selling on Amazon plus Shopify plus a wholesale channel means the same physical units back several storefronts at once. US ecommerce keeps growing as a share of total retail, as the Census Bureau’s quarterly figures show, and most brands respond by adding channels faster than they add inventory infrastructure.
The failure mode is overselling: two channels sell the same last unit, and someone gets a cancellation email. The fix is one source of truth for stock levels with allocation rules per channel. Even a basic rule set helps: reserve X units for wholesale commitments, cap the Shopify buffer, let Amazon draw from the rest. What does not work is manually syncing spreadsheets across channels every morning, because the one morning someone skips is the morning a viral spike hits.
Multichannel also changes the profitability math per unit. A unit sold through FBA, through Shopify with a 3PL pick fee, and through wholesale at distributor pricing produces three very different margins, so allocation is not just an operational question. If you cannot see true landed profit per SKU per channel, start with SKU-level profit analytics before you optimize anything else, because you may discover some channels deserve less inventory, not more.
What does not work
A few traps we see repeatedly in audits, named honestly.
Spreadsheet-only management past about 20 SKUs. The math is not hard, but the manual refresh is fragile. The sheet is always three days stale, and three days is exactly the margin between catching a reorder point and missing it.
Software as a substitute for ownership. Inventory tools are genuinely useful, but a dashboard nobody reviews weekly changes nothing. The brands that stay in stock have a named person who owns replenishment and a fixed weekly ritual, even when the tooling is modest.
Chasing unit cost with giant POs. A 10 percent price break for tripling the order size feels like a win and often is not. Run the real comparison: the discount saved versus months of extra storage fees, capital locked up, and the risk the product iterates before the stock sells through. Cheaper sourcing that weakens your cash position is not cheaper.
Set-and-forget reorder points. Velocity drifts, lead times drift, and a reorder point calculated in March is quietly wrong by August. Recalculate monthly. It takes an hour and prevents the majority of surprise stockouts we get called in to fix.
What to fix this week
You do not need a transformation project. One focused week gets most brands out of the danger zone.
First, build a days-of-cover report for every SKU and sort it. Anything under your lead time is an emergency: expedite, raise price to slow velocity, or pause ads on it. Anything over 180 days is a cash recovery project: bundle it, promote it, or liquidate it and redeploy the money.
Second, write down real lead times per supplier, door to door, including production queue, freight, and check-in. Most sellers quote the supplier’s production time and forget the other half.
Third, calculate reorder points for your top ten SKUs by revenue using the formula above, and put a weekly 30-minute replenishment review on the calendar. That single ritual, held every week, outperforms any tool bought and ignored.
Frequently asked questions
How much inventory should an ecommerce business hold?
Enough to cover total replenishment lead time plus safety stock, usually 45 to 90 days of cover for Amazon-centric brands. The right number varies by SKU: hero products with rank to protect justify more cover, while long-tail SKUs can run leaner because the cost of a brief stockout is small.
What is the difference between inventory management and supply chain management?
Inventory management decides how much stock to hold and when to reorder. Supply chain management covers the wider flow: sourcing, supplier terms, freight, warehousing, and distribution. Inventory management is one function inside supply chain management, and weak upstream links like unreliable suppliers usually surface as inventory problems downstream.
How do I forecast demand for a new product with no sales history?
Borrow a baseline from the closest comparable SKU in your catalog or category, start with a conservative first order, and shorten your review cycle to weekly until you have 60 to 90 days of real data. The goal for a launch is learning speed, not forecast precision.
When should an ecommerce brand outsource inventory management?
When stockouts or overstock are repeatedly costing more than help would, or when the founder is personally running replenishment past roughly seven figures in revenue. At that scale the hours and the error cost both exceed what an experienced operator charges.
If you want help with this
Everything above is doable in-house with discipline. What is hard is doing it every single week while also running products, ads, and everything else, and consistency is the entire game in inventory. If you would rather hand it to a team that does this daily, SellerPlex runs end, covering forecasting, reorder management, freight, and FBA replenishment. Start with a free audit: we will show you where your inventory is leaking cash and what fixing it is worth before you commit to anything.
Ready to Grow Your Amazon Business?
Book a free strategy session with our Amazon and e-commerce specialists. No obligations, just actionable insights.