
Most Amazon PPC benchmarks floating around are recycled survey answers or numbers a software vendor pulled together to sell a tool. The figures on this page come from a different place: the advertising consoles of 38 Amazon.com seller accounts that SellerPlex actively manages, covering January 1 through June 30, 2026.
Table of Contents
Behind these benchmarks sits roughly $5.2 million in ad spend, $17.6 million in ad-attributed sales, $39 million in total sales across the 36 accounts that report total sales, 5.4 million ad clicks, around 840 million impressions, and more than 380,000 ad-attributed orders.
Use this page to sanity-check your own account. An ACOS, CPC, or conversion rate far outside the ranges below is usually worth investigating, even when the account feels fine day to day.
Key benchmarks at a glance (H1 2026)
Medians across 38 managed Amazon.com accounts, with the middle 50% range (25th to 75th percentile). Each account counts once regardless of size.
Weighted by spend, the pooled portfolio looks more efficient than the per-account medians: 30% ACOS, 13% TACOS, $0.98 CPC, 0.64% CTR, 7.1% conversion rate. Larger budgets tend to get managed harder toward efficiency, so the biggest accounts pull the pooled numbers below the typical account.
Methodology
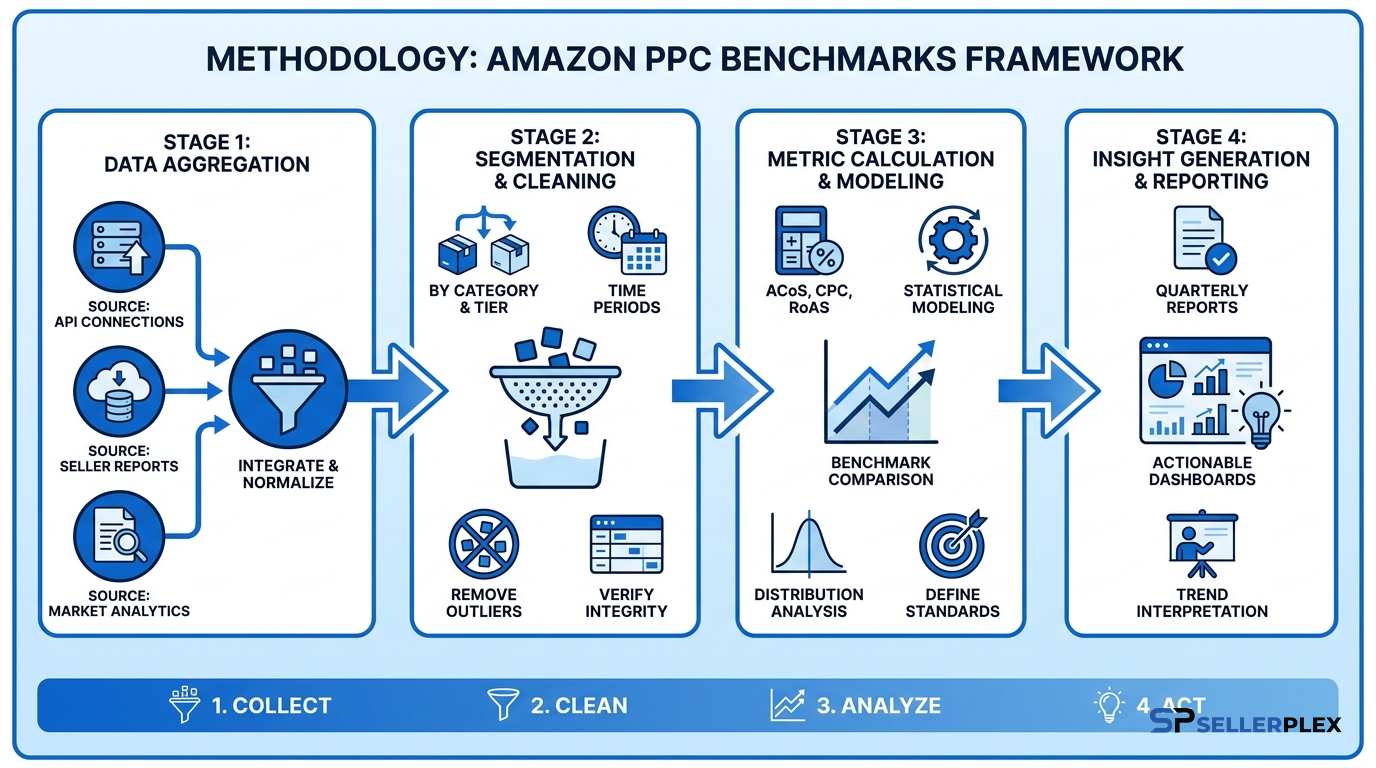
Benchmarks are aggregated across 38 Amazon.com (US marketplace) seller accounts under SellerPlex management, January 1 through June 30, 2026. We deliberately excluded the non-US accounts we manage: they bill in three different currencies, and no single non-US marketplace clears our 10-account minimum for a publishable cut.
Metrics are computed per account from daily console data, then summarized as medians and percentiles so no single account can dominate a stat. ACOS is ad spend divided by ad-attributed sales. TACOS divides ad spend by Seller Central total sales (ads plus organic) and is available for 36 of the 38 accounts. The ad-attributed share of total sales uses that same total-sales figure and was computable for 35 accounts, which is why sample size varies slightly from stat to stat; each table lists its N. Conversion rate means ad-attributed orders divided by ad clicks. Monthly stats include accounts with at least $100 of spend that month (34 to 37 accounts per month).
No cut with fewer than 10 accounts is published, all figures are rounded, and no client names, products, or categories are disclosed.
ACOS benchmarks
The median managed account ran a 38% ACOS in the first half of 2026. Half of all accounts landed between 25% and 53%. The most efficient tenth ran under 20%, while the top tenth ran above 67%.
That spread is the real finding. A single “good ACOS” number does not exist. A launch or a deliberate rank-building push can justify paying more per sale for a stretch, and so can a crowded niche, which is why plenty of professionally managed accounts sit above 50% on purpose. ACOS only means something next to your gross margin and your goal for that product, a point we unpack in our Amazon PPC cost breakdown.
The spend-weighted portfolio ACOS came out at 30%, a full 8 points under the median account. Scale and efficiency traveled together in this dataset.
TACOS benchmarks
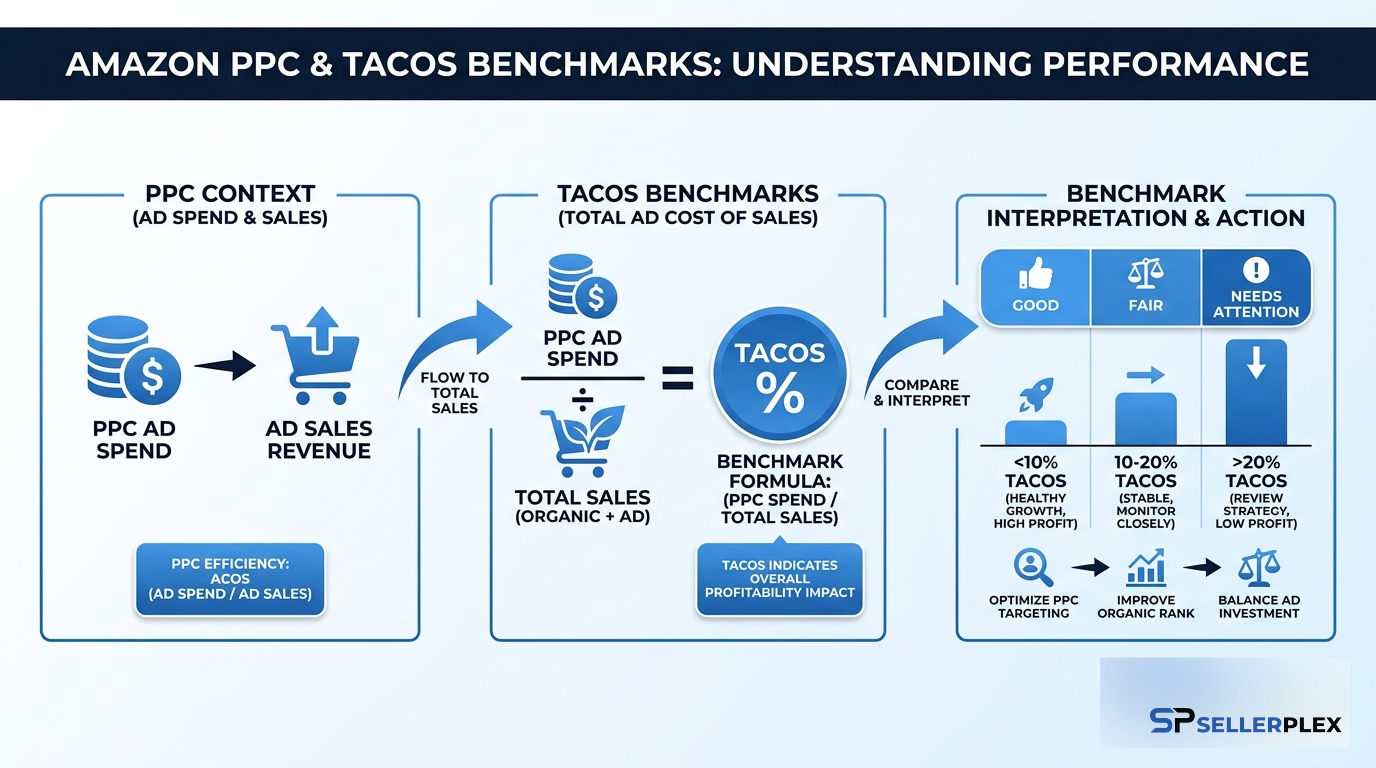
TACOS (total advertising cost of sales: ad spend divided by total revenue including organic) is the healthier number to manage a whole account by. The median managed account ran a 15% TACOS in H1 2026, with the middle half between 10% and 21%. The leanest tenth ran around 9%.
A related figure that rarely gets published anywhere: ads drove a median 41% of total sales across these accounts, and for the middle half of accounts the ad-attributed share sat between 36% and 54%. Amazon is now a paid-first channel for most managed accounts. The organic side of the business leans on the rank that paid traffic sustains, so a “we’ll just turn ads off” plan usually costs far more than the ad budget it saves.
CPC benchmarks
The median blended CPC across all campaign types, from Sponsored Products through Brands and Display, was $1.07 for the half. The middle 50% of accounts paid between $0.75 and $1.85 per click, the cheapest tenth paid under $0.45, and the most expensive tenth paid over $3.00.
The trend line matters more than the snapshot. Median CPC climbed from $0.99 in January to $1.36 in June, a 37% increase in six months. The monthly sample shifts a little as accounts cross the $100 spend floor (37 accounts in January, 34 in June), so the medians compare overlapping but not identical account sets:
Here is the part we found most interesting: the spend-weighted CPC across the same accounts rose only 20% ($0.94 to $1.13). That gap suggests the largest advertisers held their click costs down while mid-size accounts absorbed more of the inflation. Bigger accounts tend to carry more auction history and tighter negative targeting, and that machinery pays off exactly when click prices spike.
CTR benchmarks
Median click-through rate was 0.59%, with the middle half of accounts between 0.45% and 0.84% and the top tenth above 1.26%. Sustained account-level CTR above 0.8% usually signals well-matched targeting and strong main images. Below 0.4%, the account is typically paying a relevance penalty from broad targeting or ads surfacing on queries where the product does not belong.
CTR drifted down through the spring, from the 0.59% to 0.70% range in the first four months to 0.52% to 0.55% in May and June. Amazon keeps adding placements, so impressions grow faster than clicks. A slowly falling CTR is not by itself a crisis if CPC and conversion rate hold.
Conversion rate benchmarks
The median account converted 8.3% of ad clicks into orders. The middle half ran between 5.4% and 11.1%, and the best tenth converted above 18%.
Conversion rate was also the steadiest metric in the dataset, holding between 7.6% and 8.8% every single month. Click prices swung a lot in H1 while shopper behavior after the click barely budged. When conversion rate is off, the fix usually lives in the listing or the price.
How much do sellers spend on Amazon PPC?
Across the 38 accounts, average monthly ad spend per account distributed like this:
The typical professionally managed account spends around $6,500 per month on Amazon ads, and a quarter of accounts spend over $24,000 per month. Ad-attributed AOV ran a median $37 per order, with the middle half between $23 and $59.
Month-by-month trends, January to June 2026
Medians across active accounts each month:
June stands out as the least efficient month of the half. Pooled spend across the accounts jumped 22% from May while conversion rates softened, pushing median ACOS to 41%. That pattern is largely self-inflicted and seasonal: accounts ramp aggressively into Prime Day, buying visibility in the run-up while shoppers wait for the deals. If your own June ACOS looked ugly, you were in good company.
How to use these benchmarks
Judge yourself against the range rather than the median. An account anywhere inside the middle 50% band is in normal territory, and where you should sit inside that band depends on your margins and growth stage. A 45% ACOS can be excellent for a launch and terrible for a five-year-old hero SKU.
Watch TACOS before ACOS. The median managed account runs 15%, and rising TACOS against flat total sales is the single clearest trigger for a real account audit. For the tactical layer underneath these numbers, our Amazon PPC playbook covers structure, bidding, and harvesting in depth.
Frequently asked questions
What is a good ACOS on Amazon in 2026?
Across 38 managed Amazon.com accounts in H1 2026, the median ACOS was 38% and the middle half ran between 25% and 53%. Whether a given ACOS is good depends on gross margin; an ACOS below your margin makes ads directly profitable, and many brands deliberately run higher during launches.
What is a good TACOS?
Median 15% in this dataset, with the middle half of accounts between 10% and 21%. Below 10% usually means a strong organic base or under-investment in growth.
What is the average cost per click on Amazon in 2026?
Median $1.07 blended across all campaign types on Amazon.com in H1 2026. Click costs rose sharply through the half, from a $0.99 median in January to $1.36 in June.
What is the average Amazon PPC conversion rate?
Median 8.3% of ad clicks became orders, with the middle half of accounts between 5.4% and 11.1%.
How much of Amazon revenue comes from ads?
Ads drove a median 41% of total sales across these managed accounts in H1 2026.
How much do sellers spend on Amazon PPC per month?
The median managed account spent about $6,500 per month, with the middle half between $3,300 and $24,200.
About this data
These benchmarks are original aggregate statistics computed from Amazon.com advertising accounts under SellerPlex management, January through June 2026. Every figure is an aggregate across at least 34 accounts, rounded, with no client-identifying information. You are welcome to cite any number on this page with a link back to it. We plan to refresh the dataset every six months.
If your account sits outside these ranges and you want to know why, book a free audit with our Amazon PPC management team. We review ad accounts every week and will show you exactly where you stand against these benchmarks.
Ready to Grow Your Amazon Business?
Book a free strategy session with our Amazon and e-commerce specialists. No obligations, just actionable insights.